指標
概述
1. 指標存取說明
2. 指標系統設計
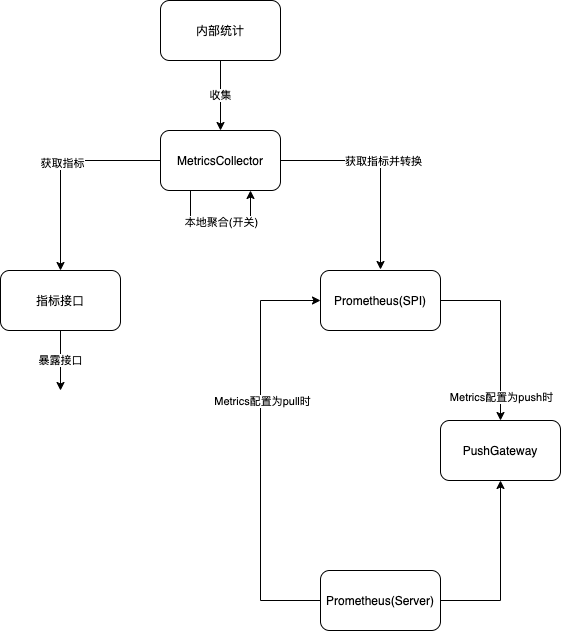
Dubbo 的指標系統總共涉及三個部分,指標收集、本地聚合和指標推送。指標收集:將 Dubbo 內部需要監控的指標推送到統一的 Collector 進行儲存。本地聚合:收集到的所有指標都是基本指標,部分分位數指標需要透過本地聚合計算。指標推送:將收集和聚合後的指標以一定方式推送到第三方伺服器,目前僅涉及 Prometheus。
3. 架構設計
- 移除原有的 Metrics 相關類別
- 新增模組 dubbo-metrics/dubbo-metrics-api、dubbo-metrics/dubbo-metrics-prometheus,MetricsConfig 作為模組的配置類別
- 使用 micrometer,在 Collector 中使用基本類型表示指標,例如 Long、Double 等,並在 dubbo-metrics-api 中引入 micrometer,使用 micrometer 轉換內部指標
4. 資料流程
5. 目標
指標介面將提供一個 MetricsService,它不僅提供彈性服務的介面級資料,還提供所有指標的查詢方法。查詢方法級指標的介面可以聲明如下
public interface MetricsService {

    /**
     * Default {@link MetricsService} extension name.
     */
    String DEFAULT_EXTENSION_NAME = "default";

    /**
     * The contract version of {@link MetricsService}, the future update must make sure compatible.
     */
    String VERSION = "1.0.0";

    /**
     * Get metrics by prefixes
     *
     * @param categories categories
     * @return metrics - key=MetricCategory value=MetricsEntityList
     */
    Map<MetricsCategory, List<MetricsEntity>> getMetricsByCategories(List<MetricsCategory> categories);

    /**
     * Get metrics by interface and prefixes
     *
     * @param serviceUniqueName serviceUniqueName (eg.group/interfaceName:version)
     * @param categories categories
     * @return metrics - key=MetricCategory value=MetricsEntityList
     */
    Map<MetricsCategory, List<MetricsEntity>> getMetricsByCategories(String serviceUniqueName, List<MetricsCategory> categories);

    /**
     * Get metrics by interface、method and prefixes
     *
     * @param serviceUniqueName serviceUniqueName (eg.group/interfaceName:version)
     * @param methodName methodName
     * @param parameterTypes method parameter types
     * @param categories categories
     * @return metrics - key=MetricCategory value=MetricsEntityList
     */
    Map<MetricsCategory, List<MetricsEntity>> getMetricsByCategories(String serviceUniqueName, String methodName, Class<?>[] parameterTypes, List<MetricsCategory> categories);
}
其中,MetricsCategory 的設計如下
public enum MetricsCategory {
    RT,
    QPS,
    REQUESTS,
}
MetricsEntity 的設計如下
public class MetricsEntity {
    private String name;
    private Map<String, String> tags;
    private MetricsCategory category;
    private Object value;
}
指標收集
1. 嵌入位置
Dubbo 架構圖如下 
在 provider 端新增一層 MetricsFilter,重寫 invoke 方法,嵌入呼叫鏈路收集指標,並使用 try-catch-finally 進行處理。核心程式碼如下
@Activate(group = PROVIDER, order = -1)
public class MetricsFilter implements Filter, ScopeModelAware {
    @Override
    public Result invoke(Invoker<?> invoker, Invocation invocation) throws RpcException {
        collector.increaseTotalRequests(interfaceName, methodName, group, version);
        collector.increaseProcessingRequests(interfaceName, methodName, group, version);
        Long startTime = System.currentTimeMillis();
        try {
            Result invoke = invoker.invoke(invocation);
            collector.increaseSucceedRequests(interfaceName, methodName, group, version);
            return invoke;
        } catch (RpcException e) {
            collector.increaseFailedRequests(interfaceName, methodName, group, version);
            throw e;
        } finally {
            Long endTime = System.currentTimeMillis();
            Long rt = endTime - startTime;
            collector.addRT(interfaceName, methodName, group, version, rt);
            collector.decreaseProcessingRequests(interfaceName, methodName, group, version);
        }
    }
}
2. 指標識別
使用以下五個屬性作為隔離層級來區分和識別不同的方法,它們也是每個 ConcurrentHashMap 的鍵值
public class MethodMetric {
    private String applicationName;
    private String interfaceName;
    private String methodName;
    private String group;
    private String version;
}
3. 基本指標
Metrics 透過 common 模組下的 MetricsCollector 儲存所有指標資料
public class DefaultMetricsCollector implements MetricsCollector {
    private Boolean collectEnabled = false;
    private final List<MetricsListener> listeners = new ArrayList<>();
    private final ApplicationModel applicationModel;
    private final String applicationName;

    private final Map<MethodMetric, AtomicLong> totalRequests = new ConcurrentHashMap<>();
    private final Map<MethodMetric, AtomicLong> succeedRequests = new ConcurrentHashMap<>();
    private final Map<MethodMetric, AtomicLong> failedRequests = new ConcurrentHashMap<>();
    private final Map<MethodMetric, AtomicLong> processingRequests = new ConcurrentHashMap<>();

    private final Map<MethodMetric, AtomicLong> lastRT = new ConcurrentHashMap<>();
    private final Map<MethodMetric, LongAccumulator> minRT = new ConcurrentHashMap<>();
    private final Map<MethodMetric, LongAccumulator> maxRT = new ConcurrentHashMap<>();
    private final Map<MethodMetric, AtomicLong> avgRT = new ConcurrentHashMap<>();
    private final Map<MethodMetric, AtomicLong> totalRT = new ConcurrentHashMap<>();
    private final Map<MethodMetric, AtomicLong> rtCount = new ConcurrentHashMap<>();
 }
本地聚合
本地聚合是指透過計算一些簡單指標來獲得分位數指標的過程
1. 參數設計
預設情況下,指標採集只收集基本指標,部分獨立的聚合指標需要啟用服務彈性或啟動新的執行緒於本地聚合後計算。如果在此啟用服務彈性,則預設啟用本地聚合。
1.1 如何啟用本地聚合
<dubbo:metrics>
  <dubbo:aggregation enable="true" />
</dubbo:metrics>
1.2 指標聚合參數
<dubbo:metrics>
  <dubbo:aggregation enable="true" bucket-num="5" time-window-seconds="10"/>
</dubbo:metrics>
2. 特定指標
監控的四個關鍵指標,稱為「黃金指標」:延遲、流量、錯誤和飽和度。Dubbo 主要包含以下監控指標:
| 基礎設施 | 業務監控 | |
|---|---|---|
| 延遲 (Latency) | IO 等待;RPC 延遲; | 介面、平均服務時間、TP90、TP99、TP999 等。 |
| 流量 (Traffic) | 網路和磁碟 IO; | 服務級別的 QPS |
| 錯誤 (Errors) | 停機時間;磁碟(壞碟或檔案系統錯誤);程序或埠掛起;網路封包丟失; | 錯誤日誌;業務狀態碼、錯誤碼趨勢; |
| 飽和度 (Saturation) | 系統資源利用率:CPU、記憶體、磁碟、網路等;飽和度:等待執行緒數、佇列積壓長度; | 這主要包括 JVM、執行緒池等。 |
- qps:基於滑動視窗取得動態 qps
- rt:基於滑動視窗取得動態 rt
- 失敗請求數:基於滑動視窗取得最新時間內的失敗請求數
- 成功請求數:基於滑動視窗取得最新時間內的成功請求數
- 處理請求數:透過在 Filter 前後添加簡單統計
- 特定指標依賴滑動視窗,並額外使用 AggregateMetricsCollector 進行收集
輸出到 Prometheus 的相關指標可參考如下
# HELP jvm_gc_live_data_size_bytes Size of long-lived heap memory pool after reclamation
# TYPE jvm_gc_live_data_size_bytes gauge
jvm_gc_live_data_size_bytes 1.6086528E7
# HELP requests_succeed_aggregate Aggregated Succeed Requests
# TYPE requests_succeed_aggregate gauge
requests_succeed_aggregate{application_name="metrics-provider",group="",hostname="iZ8lgm9icspkthZ",interface="org.apache.dubbo.samples.metrics.prometheus.api.DemoService",ip="172.28.236.104",method="sayHello",version="",} 39.0
# HELP jvm_buffer_memory_used_bytes An estimate of the memory that the Java virtual machine is using for this buffer pool
# TYPE jvm_buffer_memory_used_bytes gauge
jvm_buffer_memory_used_bytes{id="direct",} 1.679975E7
jvm_buffer_memory_used_bytes{id="mapped",} 0.0
# HELP jvm_gc_memory_allocated_bytes_total Incremented for an increase in the size of the (young) heap memory pool after one GC to before the next
# TYPE jvm_gc_memory_allocated_bytes_total counter
jvm_gc_memory_allocated_bytes_total 2.9884416E9
# HELP requests_total_aggregate Aggregated Total Requests
# TYPE requests_total_aggregate gauge
requests_total_aggregate{application_name="metrics-provider",group="",hostname="iZ8lgm9icspkthZ",interface="org.apache.dubbo.samples.metrics.prometheus.api.DemoService",ip="172.28.236.104",method="sayHello",version="",} 39.0
# HELP system_load_average_1m The sum of the number of runnable entities queued to available processors and the number of runnable entities running on the available processors averaged over a period of time
# TYPE system_load_average_1m gauge
system_load_average_1m 0.0
# HELP system_cpu_usage The "recent cpu usage" for the whole system
# TYPE system_cpu_usage gauge
system_cpu_usage 0.015802269043760128
# HELP jvm_threads_peak_threads The peak live thread count since the Java virtual machine started or peak was reset
# TYPE jvm_threads_peak_threads gauge
jvm_threads_peak_threads 40.0
# HELP requests_processing Processing Requests
# TYPE requests_processing gauge
requests_processing{application_name="metrics-provider",group="",hostname="iZ8lgm9icspkthZ",interface="org.apache.dubbo.samples.metrics.prometheus.api.DemoService",ip="172.28.236.104",method="sayHello",version="",} 0.0
# HELP jvm_memory_max_bytes The maximum amount of memory in bytes that can be used for memory management
# TYPE jvm_memory_max_bytes gauge
jvm_memory_max_bytes{area="nonheap",id="CodeHeap 'profiled nmethods'",} 1.22912768E8
jvm_memory_max_bytes{area="heap",id="G1 Survivor Space",} -1.0
jvm_memory_max_bytes{area="heap",id="G1 Old Gen",} 9.52107008E8
jvm_memory_max_bytes{area="nonheap",id="Metaspace",} -1.0
jvm_memory_max_bytes{area="heap",id="G1 Eden Space",} -1.0
jvm_memory_max_bytes{area="nonheap",id="CodeHeap 'non-nmethods'",} 5828608.0
jvm_memory_max_bytes{area="nonheap",id="Compressed Class Space",} 1.073741824E9
jvm_memory_max_bytes{area="nonheap",id="CodeHeap 'non-profiled nmethods'",} 1.22916864E8
# HELP jvm_threads_states_threads The current number of threads having BLOCKED state
# TYPE jvm_threads_states_threads gauge
jvm_threads_states_threads{state="blocked",} 0.0
jvm_threads_states_threads{state="runnable",} 10.0
jvm_threads_states_threads{state="waiting",} 16.0
jvm_threads_states_threads{state="timed-waiting",} 13.0
jvm_threads_states_threads{state="new",} 0.0
jvm_threads_states_threads{state="terminated",} 0.0
# HELP jvm_buffer_total_capacity_bytes An estimate of the total capacity of the buffers in this pool
# TYPE jvm_buffer_total_capacity_bytes gauge
jvm_buffer_total_capacity_bytes{id="direct",} 1.6799749E7
jvm_buffer_total_capacity_bytes{id="mapped",} 0.0
# HELP rt_p99 Response Time P99
# TYPE rt_p99 gauge
rt_p99{application_name="metrics-provider",group="",hostname="iZ8lgm9icspkthZ",interface="org.apache.dubbo.samples.metrics.prometheus.api.DemoService",ip="172.28.236.104",method="sayHello",version="",} 1.0
# HELP jvm_memory_used_bytes The amount of used memory
# TYPE jvm_memory_used_bytes gauge
jvm_memory_used_bytes{area="heap",id="G1 Survivor Space",} 1048576.0
jvm_memory_used_bytes{area="nonheap",id="CodeHeap 'profiled nmethods'",} 1.462464E7
jvm_memory_used_bytes{area="heap",id="G1 Old Gen",} 1.6098728E7
jvm_memory_used_bytes{area="nonheap",id="Metaspace",} 4.0126952E7
jvm_memory_used_bytes{area="heap",id="G1 Eden Space",} 8.2837504E7
jvm_memory_used_bytes{area="nonheap",id="CodeHeap 'non-nmethods'",} 1372032.0
jvm_memory_used_bytes{area="nonheap",id="Compressed Class Space",} 4519248.0
jvm_memory_used_bytes{area="nonheap",id="CodeHeap 'non-profiled nmethods'",} 5697408.0
# HELP qps Query Per Seconds
# TYPE qps gauge
qps{application_name="metrics-provider",group="",hostname="iZ8lgm9icspkthZ",interface="org.apache.dubbo.samples.metrics.prometheus.api.DemoService",ip="172.28.236.104",method="sayHello",version="",} 0.3333333333333333
# HELP rt_min Min Response Time
# TYPE rt_min gauge
rt_min{application_name="metrics-provider",group="",hostname="iZ8lgm9icspkthZ",interface="org.apache.dubbo.samples.metrics.prometheus.api.DemoService",ip="172.28.236.104",method="sayHello",version="",} 0.0
# HELP jvm_buffer_count_buffers An estimate of the number of buffers in the pool
# TYPE jvm_buffer_count_buffers gauge
jvm_buffer_count_buffers{id="mapped",} 0.0
jvm_buffer_count_buffers{id="direct",} 10.0
# HELP system_cpu_count The number of processors available to the Java virtual machine
# TYPE system_cpu_count gauge
system_cpu_count 2.0
# HELP jvm_classes_loaded_classes The number of classes that are currently loaded in the Java virtual machine
# TYPE jvm_classes_loaded_classes gauge
jvm_classes_loaded_classes 7325.0
# HELP rt_total Total Response Time
# TYPE rt_total gauge
rt_total{application_name="metrics-provider",group="",hostname="iZ8lgm9icspkthZ",interface="org.apache.dubbo.samples.metrics.prometheus.api.DemoService",ip="172.28.236.104",method="sayHello",version="",} 2783.0
# HELP rt_last Last Response Time
# TYPE rt_last gauge
rt_last{application_name="metrics-provider",group="",hostname="iZ8lgm9icspkthZ",interface="org.apache.dubbo.samples.metrics.prometheus.api.DemoService",ip="172.28.236.104",method="sayHello",version="",} 0.0
# HELP jvm_gc_memory_promoted_bytes_total Count of positive increases in the size of the old generation memory pool before GC to after GC
# TYPE jvm_gc_memory_promoted_bytes_total counter
jvm_gc_memory_promoted_bytes_total 1.4450952E7
# HELP jvm_gc_pause_seconds Time spent in GC pause
# TYPE jvm_gc_pause_seconds summary
jvm_gc_pause_seconds_count{action="end of minor GC",cause="Metadata GC Threshold",} 2.0
jvm_gc_pause_seconds_sum{action="end of minor GC",cause="Metadata GC Threshold",} 0.026
jvm_gc_pause_seconds_count{action="end of minor GC",cause="G1 Evacuation Pause",} 37.0
jvm_gc_pause_seconds_sum{action="end of minor GC",cause="G1 Evacuation Pause",} 0.156
# HELP jvm_gc_pause_seconds_max Time spent in GC pause
# TYPE jvm_gc_pause_seconds_max gauge
jvm_gc_pause_seconds_max{action="end of minor GC",cause="Metadata GC Threshold",} 0.0
jvm_gc_pause_seconds_max{action="end of minor GC",cause="G1 Evacuation Pause",} 0.0
# HELP rt_p95 Response Time P95
# TYPE rt_p95 gauge
rt_p95{application_name="metrics-provider",group="",hostname="iZ8lgm9icspkthZ",interface="org.apache.dubbo.samples.metrics.prometheus.api.DemoService",ip="172.28.236.104",method="sayHello",version="",} 0.0
# HELP requests_total Total Requests
# TYPE requests_total gauge
requests_total{application_name="metrics-provider",group="",hostname="iZ8lgm9icspkthZ",interface="org.apache.dubbo.samples.metrics.prometheus.api.DemoService",ip="172.28.236.104",method="sayHello",version="",} 27738.0
# HELP process_cpu_usage The "recent cpu usage" for the Java Virtual Machine process
# TYPE process_cpu_usage gauge
process_cpu_usage 8.103727714748784E-4
# HELP rt_max Max Response Time
# TYPE rt_max gauge
rt_max{application_name="metrics-provider",group="",hostname="iZ8lgm9icspkthZ",interface="org.apache.dubbo.samples.metrics.prometheus.api.DemoService",ip="172.28.236.104",method="sayHello",version="",} 4.0
# HELP jvm_gc_max_data_size_bytes Max size of long-lived heap memory pool
# TYPE jvm_gc_max_data_size_bytes gauge
jvm_gc_max_data_size_bytes 9.52107008E8
# HELP jvm_threads_live_threads The current number of live threads including both daemon and non-daemon threads
# TYPE jvm_threads_live_threads gauge
jvm_threads_live_threads 39.0
# HELP jvm_threads_daemon_threads The current number of live daemon threads
# TYPE jvm_threads_daemon_threads gauge
jvm_threads_daemon_threads 36.0
# HELP jvm_classes_unloaded_classes_total The total number of classes unloaded since the Java virtual machine has started execution
# TYPE jvm_classes_unloaded_classes_total counter
jvm_classes_unloaded_classes_total 0.0
# HELP jvm_memory_committed_bytes The amount of memory in bytes that is committed for the Java virtual machine to use
# TYPE jvm_memory_committed_bytes gauge
jvm_memory_committed_bytes{area="nonheap",id="CodeHeap 'profiled nmethods'",} 1.4680064E7
jvm_memory_committed_bytes{area="heap",id="G1 Survivor Space",} 1048576.0
jvm_memory_committed_bytes{area="heap",id="G1 Old Gen",} 5.24288E7
jvm_memory_committed_bytes{area="nonheap",id="Metaspace",} 4.1623552E7
jvm_memory_committed_bytes{area="heap",id="G1 Eden Space",} 9.0177536E7
jvm_memory_committed_bytes{area="nonheap",id="CodeHeap 'non-nmethods'",} 2555904.0
jvm_memory_committed_bytes{area="nonheap",id="Compressed Class Space",} 5111808.0
jvm_memory_committed_bytes{area="nonheap",id="CodeHeap 'non-profiled nmethods'",} 5701632.0
# HELP requests_succeed Succeed Requests
# TYPE requests_succeed gauge
requests_succeed{application_name="metrics-provider",group="",hostname="iZ8lgm9icspkthZ",interface="org.apache.dubbo.samples.metrics.prometheus.api.DemoService",ip="172.28.236.104",method="sayHello",version="",} 27738.0
# HELP rt_avg Average Response Time
# TYPE rt_avg gauge
rt_avg{application_name="metrics-provider",group="",hostname="iZ8lgm9icspkthZ",interface="org.apache.dubbo.samples.metrics.prometheus.api.DemoService",ip="172.28.236.104",method="sayHello",version="",} 0.0
聚合收集器
public class AggregateMetricsCollector implements MetricsCollector, MetricsListener {
    private int bucketNum;
    private int timeWindowSeconds;

    private final Map<MethodMetric, TimeWindowCounter> totalRequests = new ConcurrentHashMap<>();
    private final Map<MethodMetric, TimeWindowCounter> succeedRequests = new ConcurrentHashMap<>();
    private final Map<MethodMetric, TimeWindowCounter> failedRequests = new ConcurrentHashMap<>();
    private final Map<MethodMetric, TimeWindowCounter> qps = new ConcurrentHashMap<>();
    private final Map<MethodMetric, TimeWindowQuantile> rt = new ConcurrentHashMap<>();

    private final ApplicationModel applicationModel;

    private static final Integer DEFAULT_COMPRESSION = 100;
    private static final Integer DEFAULT_BUCKET_NUM = 10;
    private static final Integer DEFAULT_TIME_WINDOW_SECONDS = 120;

//在构造函数中解析配置信息

    public AggregateMetricsCollector(ApplicationModel applicationModel) {
        this.applicationModel = applicationModel;
        ConfigManager configManager = applicationModel.getApplicationConfigManager();
        MetricsConfig config = configManager.getMetrics().orElse(null);
        if (config != null && config.getAggregation() != null && Boolean.TRUE.equals(config.getAggregation().getEnabled())) {
            // only registered when aggregation is enabled.
            registerListener();

            AggregationConfig aggregation = config.getAggregation();
            this.bucketNum = aggregation.getBucketNum() == null ? DEFAULT_BUCKET_NUM : aggregation.getBucketNum();
            this.timeWindowSeconds = aggregation.getTimeWindowSeconds() == null ? DEFAULT_TIME_WINDOW_SECONDS : aggregation.getTimeWindowSeconds();
        }
    }
}
如果啟用了本地聚合,則會透過 Spring 的 BeanFactory 新增監聽器,并将 AggregateMetricsCollector 綁定到 DefaultMetricsCollector 以實現生產者-消費者模型。DefaultMetricsCollector 使用監聽器列表以便於擴展。
private void registerListener() {
    applicationModel.getBeanFactory().getBean(DefaultMetricsCollector.class).addListener(this);
}
3. 指標聚合
滑動視窗:假設我們最初有 6 個桶,每個視窗時間設定為 2 分鐘。每次寫入指標數據時,數據會分別寫入 6 個桶中,每兩分鐘會移動一個桶,並清除原桶中的數據。讀取指標時,讀取當前 current 指向的桶,以達到滑動視窗的效果。具體來說,如下图所示,當前桶儲存設定的桶生命週期內的數據,即最近的數據。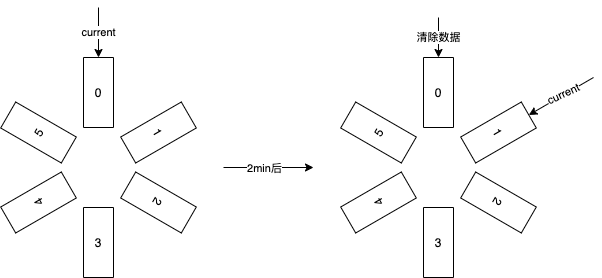
在每個桶中,使用 **TDigest 演算法** 計算分位數指標。
**TDigest 演算法**(極端分位數精度高,例如 p1 p99,中間分位數精度低,例如 p50),相關資訊如下:
- https://op8867555.github.io/posts/2018-04-09-tdigest.html
- https://blog.csdn.net/csdnnews/article/details/116246540
- 開放原始碼實作:https://github.com/tdunning/t-digest
程式碼實現如下,除了使用 TimeWindowQuantile 計算分位數指標外,還提供了 TimeWindowCounter 來收集時間區間內的指標數量。
public class TimeWindowQuantile {
    private final double compression;
    private final TDigest[] ringBuffer;
    private int currentBucket;
    private long lastRotateTimestampMillis;
    private final long durationBetweenRotatesMillis;

    public TimeWindowQuantile(double compression, int bucketNum, int timeWindowSeconds) {
        this.compression = compression;
        this.ringBuffer = new TDigest[bucketNum];
        for (int i = 0; i < bucketNum; i++) {
            this.ringBuffer[i] = TDigest.createDigest(compression);
        }

        this.currentBucket = 0;
        this.lastRotateTimestampMillis = System.currentTimeMillis();
        this.durationBetweenRotatesMillis = TimeUnit.SECONDS.toMillis(timeWindowSeconds) / bucketNum;
    }

    public synchronized double quantile(double q) {
        TDigest currentBucket = rotate();
        return currentBucket.quantile(q);
    }

    public synchronized void add(double value) {
        rotate();
        for (TDigest bucket : ringBuffer) {
            bucket.add(value);
        }
    }

    private TDigest rotate() {
        long timeSinceLastRotateMillis = System.currentTimeMillis() - lastRotateTimestampMillis;
        while (timeSinceLastRotateMillis > durationBetweenRotatesMillis) {
            ringBuffer[currentBucket] = TDigest.createDigest(compression);
            if (++currentBucket >= ringBuffer.length) {
                currentBucket = 0;
            }
            timeSinceLastRotateMillis -= durationBetweenRotatesMillis;
            lastRotateTimestampMillis += durationBetweenRotatesMillis;
        }
        return ringBuffer[currentBucket];
    }
}
指標推送
只有在使用者設定了 <dubbo:metrics /> 配置,並配置了協定參數後,才能啟用指標推送。如果僅啟用指標聚合,則預設不會推送指標。
1. Prometheus 拉取服務發現
使用 dubbo-admin 等類似中介層,並根據啟動時的配置,將本地 IP、Port 和 MetricsURL 地址信息推送到 dubbo-admin(或任何中介層),並暴露 HTTP ServiceDiscovery 供 Prometheus 讀取。配置方法如下:`<dubbo:metrics protocol="prometheus" mode="pull" address="${dubbo-admin.address}" port="20888" url="/metrics"/>`,其中 address 是 pull 模式下的選用參數,如果未填寫,則用戶需要在 Prometheus 配置文件中手動配置地址。
private void exportHttpServer() {
    boolean exporterEnabled = url.getParameter(PROMETHEUS_EXPORTER_ENABLED_KEY, false);
    if (exporterEnabled) {
        int port = url.getParameter(PROMETHEUS_EXPORTER_METRICS_PORT_KEY, PROMETHEUS_DEFAULT_METRICS_PORT);
        String path = url.getParameter(PROMETHEUS_EXPORTER_METRICS_PATH_KEY, PROMETHEUS_DEFAULT_METRICS_PATH);
        if (!path.startsWith("/")) {
            path = "/" + path;
        }

        try {
            prometheusExporterHttpServer = HttpServer.create(new InetSocketAddress(port), 0);
            prometheusExporterHttpServer.createContext(path, httpExchange -> {
                String response = prometheusRegistry.scrape();
                httpExchange.sendResponseHeaders(200, response.getBytes().length);
                try (OutputStream os = httpExchange.getResponseBody()) {
                    os.write(response.getBytes());
                }
            });

            httpServerThread = new Thread(prometheusExporterHttpServer::start);
            httpServerThread.start();
        } catch (IOException e) {
            throw new RuntimeException(e);
        }
    }
}
2. Prometheus 推送至 Pushgateway
用戶可以直接在 Dubbo 配置文件中配置 Prometheus Pushgateway 的地址,例如 `<dubbo:metrics protocol="prometheus" mode="push" address="${prometheus.pushgateway-url}" interval="5" />`,其中 interval 表示推送間隔。
private void schedulePushJob() {
    boolean pushEnabled = url.getParameter(PROMETHEUS_PUSHGATEWAY_ENABLED_KEY, false);
    if (pushEnabled) {
        String baseUrl = url.getParameter(PROMETHEUS_PUSHGATEWAY_BASE_URL_KEY);
        String job = url.getParameter(PROMETHEUS_PUSHGATEWAY_JOB_KEY, PROMETHEUS_DEFAULT_JOB_NAME);
        int pushInterval = url.getParameter(PROMETHEUS_PUSHGATEWAY_PUSH_INTERVAL_KEY, PROMETHEUS_DEFAULT_PUSH_INTERVAL);
        String username = url.getParameter(PROMETHEUS_PUSHGATEWAY_USERNAME_KEY);
        String password = url.getParameter(PROMETHEUS_PUSHGATEWAY_PASSWORD_KEY);

        NamedThreadFactory threadFactory = new NamedThreadFactory("prometheus-push-job", true);
        pushJobExecutor = Executors.newScheduledThreadPool(1, threadFactory);
        PushGateway pushGateway = new PushGateway(baseUrl);
        if (!StringUtils.isBlank(username)) {
            pushGateway.setConnectionFactory(new BasicAuthHttpConnectionFactory(username, password));
        }

        pushJobExecutor.scheduleWithFixedDelay(() -> push(pushGateway, job), pushInterval, pushInterval, TimeUnit.SECONDS);
    }
}

protected void push(PushGateway pushGateway, String job) {
    try {
        pushGateway.pushAdd(prometheusRegistry.getPrometheusRegistry(), job);
    } catch (IOException e) {
        logger.error("Error occurred when pushing metrics to prometheus: ", e);
    }
}